Binary logistic regression estimates the probability that an input belongs to one of two categories. Given features extracted from a food photograph, for example, it can estimate the probability that the food is a hot dog.
You can think of the classifier as an on-off switch driven by a probability. The model supplies a smooth value between 0 and 1; a decision threshold turns that number into a choice. Hot dog or not hot dog.
The smooth function used by logistic regression can also act as a gate within a neural network. Its output controls how much signal passes through, which makes the circuit analogy useful even when the gate is partly open.
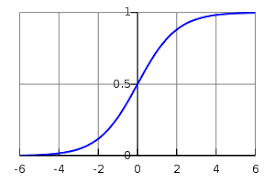
The image above traces a logistic function. It is S-shaped, or sigmoid, flattening out near 0 and 1. A score of zero maps to 0.5. Larger positive scores move the output toward 1, while more negative scores move it toward 0. The output changes most rapidly near the middle of the curve.
The same S-shaped curve can describe a population whose growth slows as it approaches the resources available to sustain it.1
Logistic regression combines a weighted input score with this curve to estimate a probability. The logistic function maps the score z to p = 1 / (1 + exp(-z)):
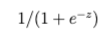
Here, exp(-z) means e raised to the power -z. Euler’s number, e, is approximately 2.71828.
The score includes an intercept and a weighted term for each input feature: z = b0 + b1*x1 + b2*x2 + b3*x3 + .... Here b0 is the intercept, each x is a feature value, and its matching b is a coefficient learned from labeled training data. For a one-feature example, b0 = -3, b1 = 2 and x1 = 2 give z = 1, which maps to a probability of about 0.73.
Neural Networks and Logistic Regression
Broadly speaking, neural networks are used for the purpose of clustering through unsupervised learning, classification through supervised learning, or regression. That is, they help group unlabeled data, categorize labeled data or predict continuous values.
A neural network for binary classification can use a sigmoid in its final layer to turn a score into a probability. The earlier layers learn the features that contribute to that score. A separate threshold can then turn the probability into a predicted class.
Logistic Regression Predicts Probabilities
For the hot-dog classifier, we can encode hotdog as 1 and not_hotdog as 0. The class encoded as 1 is called the positive class. The model’s output estimates its probability given the input features.
Using conditional-probability notation, we can write that as:
P(food=hotdog | image_features)
With a threshold of 0.5, the probability 0.73 from our example produces a positive prediction. A higher threshold would require stronger model confidence before assigning that class. Choose the threshold using validation data and the consequences of different mistakes. The scikit-learn guide to classification thresholds explains how this choice changes predictions.
Further Reading
- Logistic regression: model and objective, scikit-learn
- Logistic Regression Derived From Bayes Theorem
Footnotes
1) Imagine a herd of buffalo on the great plains. Prairie grass grows in a semi-arid desert that receives little yearly rain. These grasslands can sustain a certain number of buffalo, but not an infinite number, because the grass does not grow very fast. Now imagine that no natural predators exist for the cattle. Settlers have driven out the wolf and the bear. The buffalo begin to multiply, their population unchecked by carnivores. They eat more and more of the grass, but the grass does not grow back fast enough to satisfy the hunger of the herd. Eventually, they will face famine. The weakest will die, and their population will level off.