Graphs are networks of dots and lines. - Richard J. Trudeau
Contents
- Concrete Examples of Graph Data Structures
- Difficulties of Graph Data: Size and Structure
- Representing and Traversing Graphs for Machine Learning
- Footnotes
Graphs are data structures that can be ingested by various algorithms, notably neural nets, learning to perform tasks such as classification, clustering and regression.
TL;DR: here’s one way to make graph data ingestable for the algorithms:
Data (graph, words) -> Real number vector -> Deep neural network
Algorithms can “embed” each node of a graph into a real vector (similar to the embedding of a word). The result will be vector representation of each node in the graph with some information preserved. Once you have the real number vector, you can feed it to the neural network.
Concrete Examples of Graph Data Structures
The simplest definition of a graph is “a collection of items connected by edges.” Anyone who played with Tinker Toys as a child was building graphs with their spools and sticks. There are many problems where it’s helpful to think of things as graphs.1 The items are often called nodes or points and the edges are often called vertices, the plural of vertex. Here are a few concrete examples of a graph:
- Cities are nodes and highways are edges
- Humans are nodes and relationships between them are edges (in a social network)
- States are nodes and the transitions between them are edges (for more on states, see our post on deep reinforcement learning). For example, a video game is a graph of states connected by actions that lead from one state to the next…
- Atoms are nodes and chemical bonds are edges (in a molecule)
- Web pages are nodes and hyperlinks are edges (Hello, Google)
- A thought is a graph of synaptic firings (edges) between neurons (nodes)
- A neural network is a graph … that makes predictions about other graphs. The nodes are places where computation happens and the edges are the paths by which signal flows through the mathematical operations
Any ontology, or knowledge graph, charts the interrelationship of entities (combining symbolic AI with the graph structure):
- Taxonomies of animal species
- Diseases that share etiologies and symptoms
- Medications that share ingredients
Difficulties of Graph Data: Size and Structure
Applying neural networks and other machine-learning techniques to graph data can be difficult.
The first question to answer is: What kind of graph are you dealing with?
Let’s say you have a finite state machine, where each state is a node in the graph. You can give each state-node a unique ID, maybe a number. Then you give all the rows the names of the states, and you give all the columns the same names, so that the matrix contains an element for every state to intersect with every other state. Then you could mark those elements with a 1 or 0 to indicate whether the two states were connected in the graph, or even use weighted nodes (a continuous number) to indicate the likelihood of a transition from one state to the next. (The transition matrix below represents a finite state machine for the weather.)
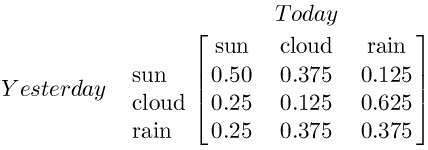
That seems simple enough, but many graphs, like social network graphs with billions of nodes (where each member is a node and each connection to another member is an edge), are simply too large to be computed. Size is one problem that graphs present as a data structure. In other words, you can’t efficiently store a large social network in a tensor. They don’t compute.
Neural nets do well on vectors and tensors; data types like images (which have structure embedded in them via pixel proximity – they have fixed size and spatiality); and sequences such as text and time series (which display structure in one direction, forward in time).
Graphs have an arbitrary structure: they are collections of things without a location in space, or with an arbitrary location. They have no proper beginning and no end, and two nodes connected to each other are not necessarily “close”.
You usually don’t feed whole graphs into neural networks, for example. They would have to be the same shape and size, and you’d have to line up your graph nodes with your network’s input nodes. But the whole point of graph-structured input is to not know or have that order. There’s no first, there’s no last.
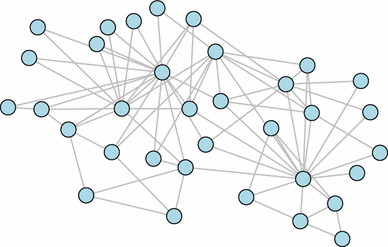
The second question when dealing with graphs is: What kind of question are you trying to answer by applying machine learning to them? In social networks, you’re usually trying to make a decision about what kind person you’re looking at, represented by the node, or what kind of friends and interactions does that person have. So you’re making predictions about the node itself or its edges.
Since that’s the case, you can address the uncomputable size of a Facebook-scale graph by looking at a node and its neighbors maybe 1-3 degrees away; i.e. a subgraph. The immediate neighborhood of the node, taking k steps down the graph in all directions, probably captures most of the information you care about. You’re filtering out the giant graph’s overwhelming size.
Representing and Traversing Graphs for Machine Learning
Let’s say you decide to give each node an arbitrary representation vector, like a low-dimensional word embedding, each node’s vector being the same length. The next step would be to traverse the graph, and that traversal could be represented by arranging the node vectors next to each other in a matrix. You could then feed that matrix representing the graph to a recurrent neural net. That’s basically DeepWalk (see below), which treats truncated random walks across a large graph as sentences.
If you turn each node into an embedding, much like word2vec does with words, then you can force a neural net model to learn representations for each node, which can then be helpful in making downstream predictions about them. (How close is this node to other things we care about?)
Another more recent approach is a graph convolutional network, which is very similar to convolutional networks: it passes a node filter over a graph much as you would pass a convolutional filter over an image, registering each time it sees a certain kind of node. The readings taken by the filters are stacked and passed to a maxpooling layer, which discards all but the strongest signal, before we return to a filter-passing convolutional layer.
One interesting aspect of graph is so-called side information, or the attributes and features associated with each node. For example, each node could have an image associated to it, in which case an algorithm attempting to make a decision about that graph might have a CNN subroutine embedded in it for those image nodes. Or the side data could be text, and the graph could be a tree (the leaves are words, intermediate nodes are phrases combining the words) over which we run a recursive neural net, an algorithm popolarized by Richard Socher.
Finally, you can compute derivative functions such as graph Laplacians from the tensors that represent the graphs, much like you might perform an eigen analysis on a tensor. These functions will tell you things about the graph that may help you classify or cluster it. (See below for more information.)
Footnotes
1) In a weird meta way it’s just graphs all the way down, not turtles. A human scientist whose head is full of firing synapses (graph) is both embedded in a larger social network (graph) and engaged in constructing ontologies of knowledge (graph) and making predictions about data with neural nets (graph).